
Introduction of data visualization
Data visualization helps transform any detailed data into understandable, visually appealing and useful business information. By leveraging external data sources, today’s data visualization tools go far beyond providing a clear view of KPIs. They also integrate data and apply AI-powered analytics to understand the relationships between KPIs, markets, and the world
Before we discuss the term “Data Visualization”, let us briefly explain the term “Data Science”. These two words are related to each other. But how? Let us understand. So, in short: “Data science is the science of using statistics and machine learning techniques to analyze raw data and draw conclusions from that information.” But do you know what a data science pipeline is? First, understand the basics of data visualization to see why it’s important before diving into your data science pipeline.
- Introduction of data visualization
- What is Data Visualization?
What is Data Visualization?
Data visualization is the graphical representation of information and data in pictorial or graphical form (data visualizations can be charts, graphs, and maps). It tools provide an accessible way to see and understand trends, patterns, and outliers in your data. Data visualization tools and technologies are essential for analyzing large amounts of information and making data-driven decisions. The concept of using images to understand data has been around for centuries. Common types of data visualization are charts, tables, graphs, maps, and dashboards.
Types of data visualization
Data visualizations can be as simple as bar graphs or scatter plots, but they can be powerful when comparing, for example, the average age of the US Congress and the average age of Americans. Here are some common data visualizations:
- Tables: Tables are data displayed in rows and columns and are easy to create in Word documents or Excel spreadsheets.
- Chart or graph: Information is displayed in a tabular format, with data displayed along the X and Y axes. Usually represented as bars, points or lines to compare data. An infographic is a special type of chart that combines visuals and words to explain data.
- Gantt Chart: A Gantt chart is a bar chart that represents timelines and tasks, especially in project management.
- Pie Chart: A pie chart divides your data into percentages that fall into pie “slices” that add up to 100%.
- Geospatial visualization: Data is displayed in map formats, such as choropleths and heat maps, with shapes and colors that show relationships between specific locations.
- Dashboard: data and visualizations, typically displayed for business purposes, to help analysts understand and present data.
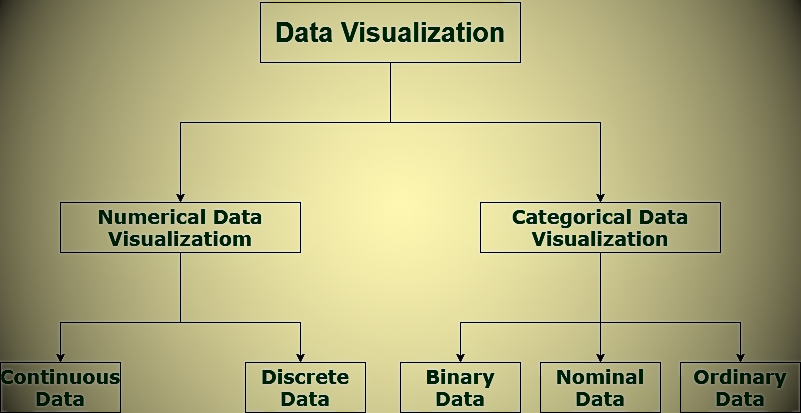
Categories of Data Visualization
It is important to have accurate data visualization for market research, where both numerical and categorical data can be visualized. This helps increase the impact of your insights and also helps reduce the risk of analysis paralysis. Therefore, data visualization falls into the following categories:
Data Visualization Categories
- Numerical Data
- Categorical Data
Data visualization examples
Data visualization tools allow you to create a variety of charts and graphs to show important data. Below are some examples of data visualization in the real world.
- Data Science: Data scientists and researchers access libraries of programming languages and tools like Python and R that they use to understand and identify patterns in data sets. This tool helps data professionals work more efficiently by coding their research using colors, plots, lines, and shapes.
- Marketing: Tracking data like web traffic and social media analytics helps marketers analyze how customers are finding their products and whether they are early or late buyers. Charts and graphs help marketers and stakeholders consolidate data to better understand these trends.
- Finance: Investors and advisors focus on buying and selling stocks, bonds, dividends, and other products, analyzing price movements over time to determine which are worth buying in the short or long term. Line charts help financial analysts visualize this data by toggling between months, years, and even decades.
- Health policy: Policy makers can use color-coded choropleth maps by geographic region (country, state, continent). For example, you can use these maps to show cancer or Ebola death rates in different regions of the world.
Tools for visualizing data
There are many data visualization tools available to suit your needs. Before committing to one, consider researching whether you need an open source site or whether you can easily create a chart using Excel or Google Charts. Below are some common data visualization tools that may suit your needs.
- Google Charts
- Dundas BI
- Power BI
- JupyteR
- Infogram
- ChartBlocks
- D3.js
- FusionCharts
- Grafana
Why is data visualization important?
Let us take an example. Let’s say you want to collect visualization data for a company’s profits from 2013 to 2023 and create a line chart. It is very easy to see that the line has always been rising and has only fallen in 2018. So, we can quickly see that the company has been consistently profitable in all years except for a loss in 2018. This is not so easy. You can get this information immediately from the data table. This is just one example of the usefulness of data visualization. Let’s take a closer look at why data visualization is so important.
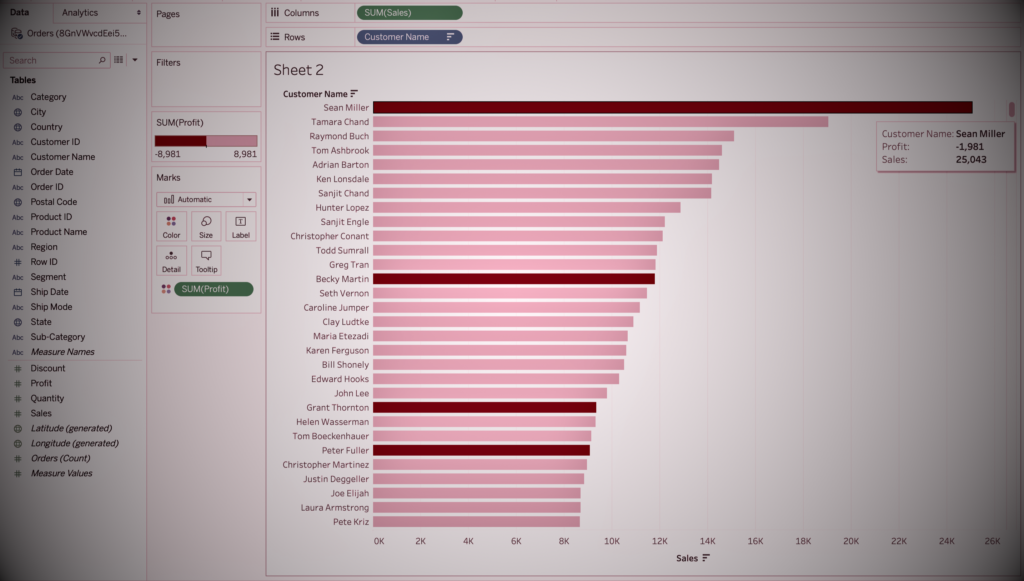
1. Data Visualization Discovers the Trending Data
The most important part of data visualization is discovering trends in your data. After all, it is much easier to observe trends in data when all the data is laid out in front of you in visual form than when it is in a table. For example, the Tableau screenshot below shows total sales by each customer in descending order. However, redness, loss, and gray indicate. So from this visualization, it is easy to see that some customers are making heavy sales but are still incurring losses. It is very difficult to observe this from the table.
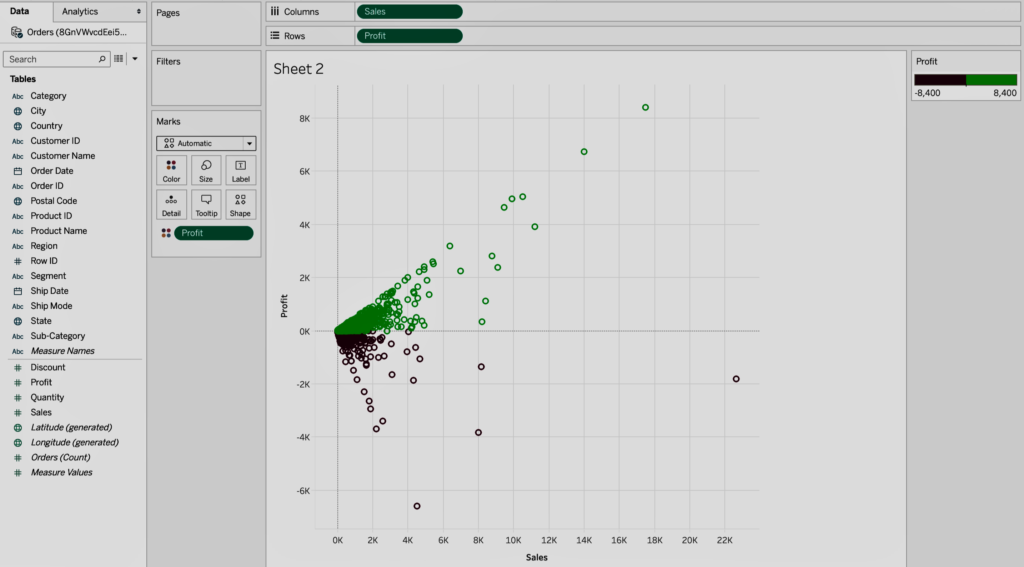
2. Data Visualization Provides a Perspective on the Data
Data visualization provides perspective on your data by showing its meaning within a larger framework. It shows how a particular data context is related to a related data picture. In the data visualization below, the data between sales and profit provides a perspective on these two metrics. It also shows that sales rarely exceed 12,000, indicating that increased sales do not necessarily mean increased profits.
3. Data Visualization Puts the Data into the Correct Context
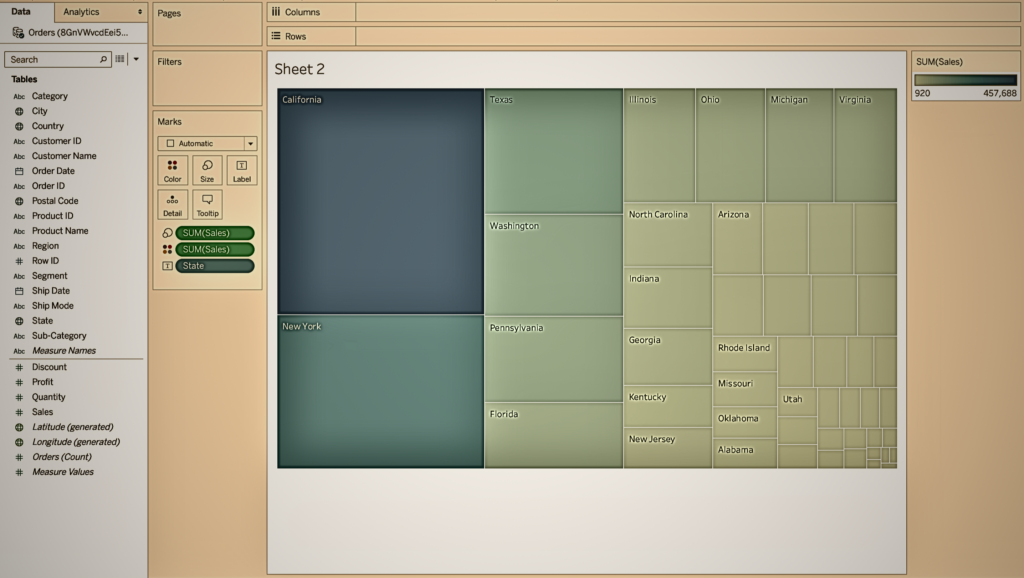
Understanding the context of the data is not easy with data visualization. The context provides a picture of the entire data, which is very difficult to understand just by reading the numbers in the table. The following data visualization in Tableau uses a tree map to show sales numbers for each region of the United States. From this data visualization, it is very easy to understand that California has the highest number of sales out of the total number of sales because its rectangle is the largest. However, it is not easy to understand this information out of context without visualizing the data.
4. Data Visualization Saves Time
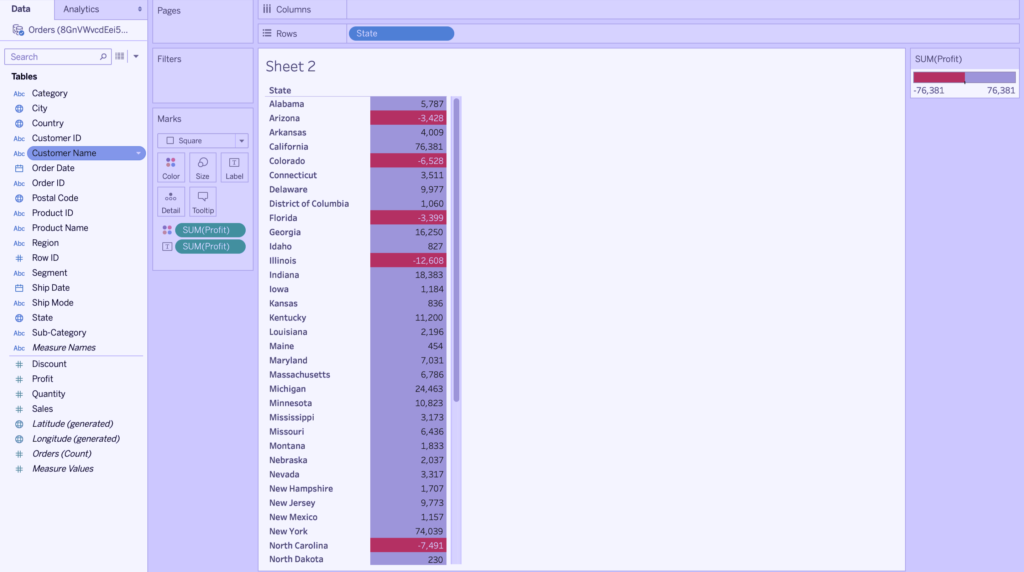
It is definitely faster to get insights from your data using data visualization than just examining the graphs. In the Tableau screenshot below, you can easily identify the states that have suffered a net loss instead of a gain. This is because all cells with damage are colored red using the heat map, so it is clear which states have suffered damage. Compare this to a regular table where you have to check if each cell has any negative values to determine the loss. In this situation, visualizing the data can save a lot of time.
5. Data Visualization Tells a Data Story
Data visualization is also a means of telling the story of your data to your audience. Visualization allows you to tell a story and lead your audience to logical conclusions while presenting the facts of your data in an easy-to-understand format. This data story, like any other type of story, needs a good beginning, a basic plot, and an ending to which it leads. For example, if a data analyst needs to create a data visualization for a company executive that details the profits of different products, the data story starts with the profits and losses of several products and includes steps to address the losses. Contains information about the methodology for recommendations.
Now that you understand the basics of data visualization and its importance, it is time to explore the advantages, disadvantages, and pipelines (with diagrams) that will help you understand how data goes through various checkpoints. is compiled, as this section explains.
What are the advantages and disadvantages of data visualization?
As simple as displaying data in a graphical format may seem like it has no downside. However, if the wrong data is placed in the visualization style, the data may be displayed incorrectly or misinterpreted. It is best to keep both advantages and disadvantages in mind when creating data visualizations.
Advantages
Our eyes are attracted to colors and patterns. You can easily identify red and blue, squares, and chi-squares. Our culture is visual, encompassing everything from art and advertising to television and movies. Data visualization is another form of visual art that engages us and keeps us focused on the message. When you look at a chart, you can immediately see trends and outliers. When we see something, we absorb it. This is a story with a purpose. If you’ve ever looked at a huge spreadsheet of data and couldn’t see any trends, you know how powerful visualization can be.
Other benefits of data visualization include:
- Share information easily.
- Explore opportunities interactively.
- Visualize patterns and relationships.
Disadvantages
Although it has many advantages, some disadvantages are less obvious. For example, when looking at visualizations with many different data points, it is easy to make misconceptions. Or, the visualization may be poorly designed, causing it to be biased or misleading.
Other disadvantages include:
- Biased or inaccurate information.
- Correlation does not necessarily mean causation.
- The original message may be lost in translation.
What is data science?
Data science is a field that focuses on extracting insights using various techniques, such as statistics, mathematics, and computer science. Data science aims to understand patterns and provide valuable insights for efficient decision-making.
For more information about data science, see What is Data Science?
Data science-related topics:
Data Science Pipeline
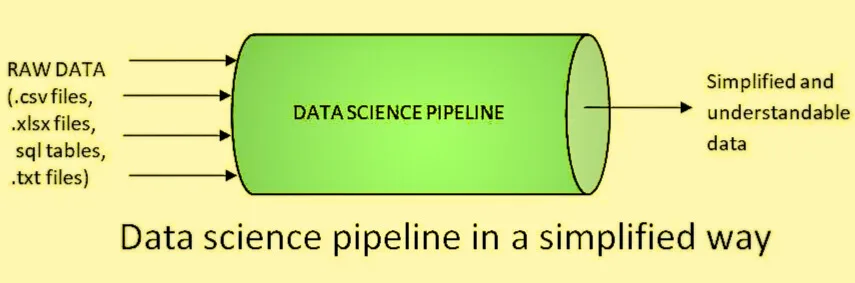
Simply put, a data science pipeline is a process that “takes raw (and confusing) data from various sources (surveys, feedback, purchase lists, surveys, etc.) and transforms it into an understandable format and analyzes it.” Used for.” ,
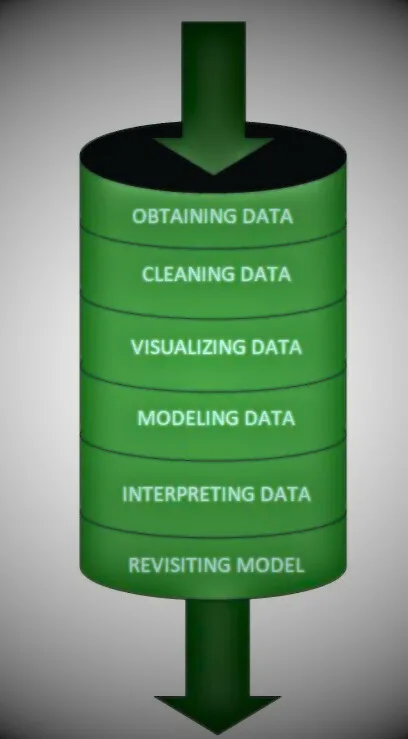
A data science pipeline also represents a number of steps that data goes through to be processed. These steps include the following:
- Acquisition/acquisition of data
- Scrubbing/cleaning data
- Data Inspection
- Error detection
- Identifying missing values
- Identifying corrupted records
- Data cleaning
- Replace or fill in missing values or errors.
- Exploratory Data Analysis or EDA
- Data Modeling
- Interpretation of Data
- Revision
The picture below also explains how raw data undergoes different stages within a pipeline.
Related Jobs post in data visualization
Data visualization is a useful skill for many industries, from marketing to data analysis. Gaining data visualization skills will help you in your next job.
- Data Visualization Analyst: As a data visualization analyst (or specialist), you will be responsible for creating and editing visual content such as maps, charts, and infographics from large data sets.
- Data Visualization Engineers: Data visualization engineers and developers specialize in helping product teams create user-friendly dashboards capable of manipulating data and telling a story using SQL.
- Data Analyst: Data analysts collect, clean, and interpret data sets to answer questions and solve business problems.
Data is everywhere. In creative roles like graphic designers, content strategists, and social media specialists, data visualization expertise can help you solve tough problems. Create dashboards to track analytics as an email marketer or create infographics as a communications designer.
Conversely, data professionals can benefit from data visualization skills to tell more impactful stories through their data.
Frequently ask questions
What is the basic principle of data visualization?
Focus on how your audience needs to use the data, and let this determine your presentation style. Provides the necessary context for interpretation and proper processing of data. Keep it simple. Remove unimportant information.
What is the main purpose of data visualization?
The importance of data visualization is simple. Data visualization helps people see, interact with, and better understand the data. Whether it’s sile or co-lex, the right visualization can get everyone on the same page, no matter their level of expertise.
What are the 5 steps in data visualization?
- Step 1: Clarify your question.
- Step 2: Understand your data and start with basic visualizations.
- Step 3: Identify the message of your visualization and generate the most informative message.
- Step 4: Select the appropriate chart type.
- Step 5: Use color, size, scale, shape, and labels to draw attention to keys.
What are the most popular data visualization techniques?
There are many common ways to visualize data, including charts (bars, lines, circles, etc.), plots (scatter plots, bubbles, boxes, etc.), maps (hetc.), dot-heatmaps, and the cartogram diagram method. Queue.
Where is data visualization used?
Data visualization allows business users to gain insight from vast amounts of data. It is useful to be able to recognize new patterns and errors in your data. Understanding these patterns can help users pay attention to red flags and areas that indicate progress. This process drives your business forward.
What are the 4 main visualization types?
- Bar charts,
- Line charts,
- scatter plots,
- pie charts, and
- heat maps
What are the three main goals of data visualization?
The three main goals of data visualization are to help organizations and individuals explore, monitor and explain insights within data.
What are the 7 stages of visualization?
The process of visualization involves seven steps: acquire, parse, filter, mine, reproduce, and interact.
What are the pillars of data visualization?
As explained in this article, every data visual has one of the five key objectives—distribution, composition, relationship trend, and comparison. Distribution: The visuals show how items are distributed into different parts.
follow me : Twitter, Facebook, LinkedIn, Instagram
2 thoughts on “Data Visualization: Importance, Tools, 4 best examples and learning resources”
Comments are closed.