Data visualization in Python represents the data in visual form for data analysis. In data visualization, the data is shown in visual form, and you can get the data as a visual summary. The human mind understands the data more easily with pictures, maps, and graphical forms. Data visualization plays a good role in representing large and small data sets.
With the help of data visualization, large quantities of data can be easily understood in a pictorial or graphical format. It allows understanding to make the best decision and identify the data in terms of new trends and patterns, and it is more efficient.
In this article, we will provide all data visualization topics in Python and learn about all modules, from basic to advanced.
What is Python?
Python is the programming language used to create websites, software, and analyze data structures. Python is used for general purposes and means designing applications, data science, software, and web applications.
Python is a widely used programming language by developers.
What is the use of Python?
Python is used for developing websites, software applications, automation tasks, analysis of data, and data visualization. Python is used in different areas, like:
- Analysis of data and machine learning
- Developing websites and software applications
- Creating scripting and automation
- Software testing
If you want to learn Python, you can achieve the certification within two months. You can learn through an online tutorial program or at any institute.
Analysis of data and machine learning
Python is used in data science for the analysis of data. It is used to create data visualization, in machine learning algorithms, manipulate the data, and in data structure programs.
Python is used for data visualization like graphs, charts, and 3D plots. With the help of Python, you can write the program for data analysis with enabled code. Python has a number of libraries with different types of code that help in machine learning and creating software and web applications.
Developing websites and software applications
Generally, python is used in the backend of websites and applications. Sending the data from servers, processing and communicating the database with the help of Python. Another role of Python is URL routing, and security. Python has several frameworks for web development, and for creating software applications.
Web developers, full-stack engineers, Python developers, and software engineers use Python in the back end.
Creating scripting and automation
An automated process that is used to write the code is called scripting. If you perform the task of writing the code, you could do it more efficiently with the help of automation in Python. On the coding side, an automation process is used to check errors in files, execute the simple match, file convert, and remove duplication of the data.
Python is used by beginners who are used to simple tasks on computers like renaming files and folders, downloading online contents, and sending emails or text files.
IT automation is a skill that can be learned and mentioned on the resume. Many companies are hiring IT automation engineers to lead this technology.
Software testing
In software line testing, Python is used for bug testing and build control. With the help of Python automated testing, software developers test new products or features. There are some Python tools that are used for software testing, like Green and Requestium.
What is data visualization in Python?
A powerful tool that is used to understand and communicate the data is called data visualization. Python provides multiple library packages with many different features for creating interactive or highly customized plots. There are excellent libraries in Python that are used in so many areas.
Here is a little overview of plotting libraries:
- Matplotlib: Provide lots of freedom at a low level. It is highly customizable.
- Panda Visualization: Easy-to-use interfaces, built in Matplotlib.
- Seaborn: It has a great default size and high-level interface. It is fast and reports presents
- Plotnine is used for the grammar of graphics.
- Plotly: It is used to create interactive plots for commercial applications and dashboards.
Popular Data Visualization in Python libraries
There are many data visualizations in Python that help to perform numerous functions, contain tools, and manage to analyze data. Each library has a particular objective: managing images, text data, data mining, data visualizations, and many more.
Here are the top 7 popular libraries for data visualization in Python.
- Matplotlib
- Plotly
- Seaborn
- Altair
- Bokeh
- Geoplotlib
- Pygal
Matplotlib
Matplotlib is the first Python data visualization library. It was first defined by John Hunter in 2002. It is the best visualization library in Python to use to generate powerful and simple visualizations. This is the 2-D plotting library, which is used in various ways, like Python, iPython sheets, and Jupyter notebooks. Matplotlib is the most used library for plotting in Python.
Matplotlib is a low-level library that provides lots of freedom. If you want to install Matplotlib, Pip and Conda can be used.
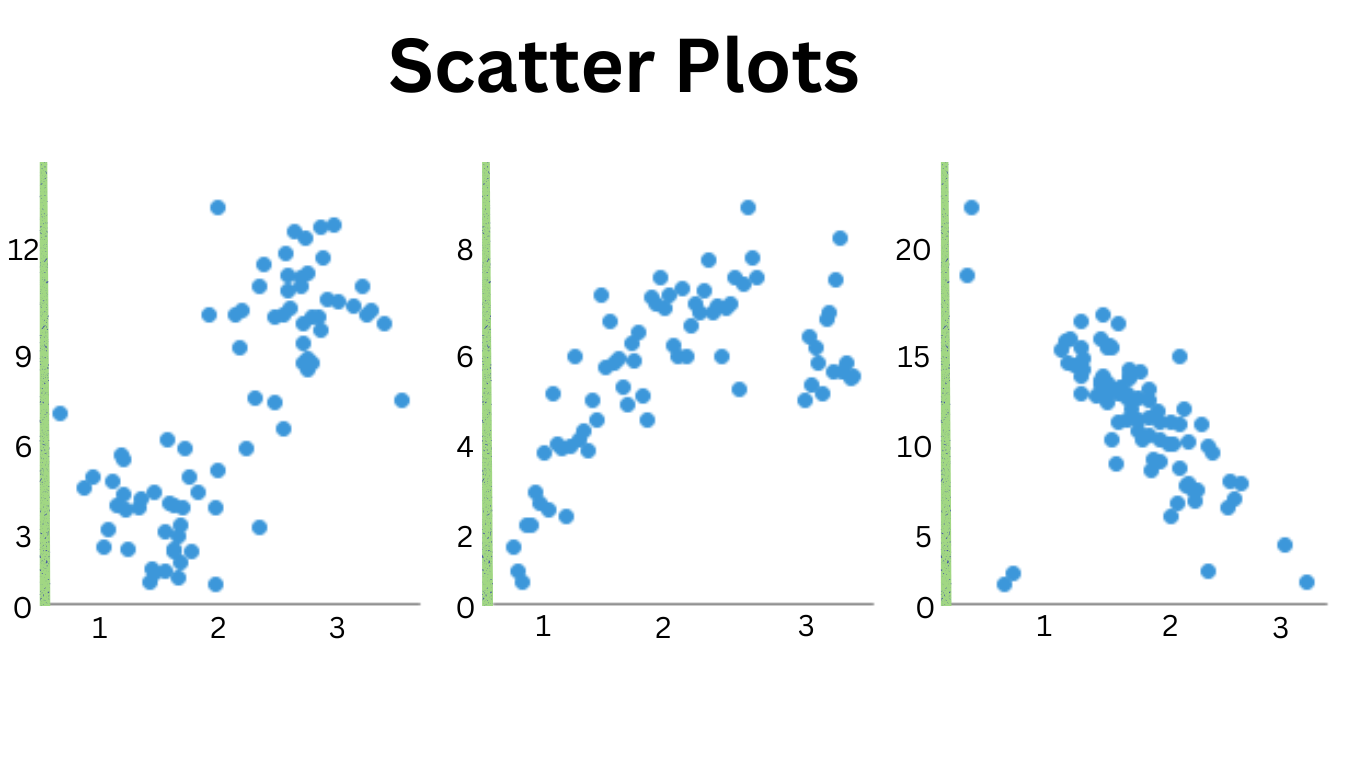
Scatter Plot
Scatter Plots introduce to relationship in visualization. With the help of the Matplotlib library, produce a scatter plot for the scatter method.
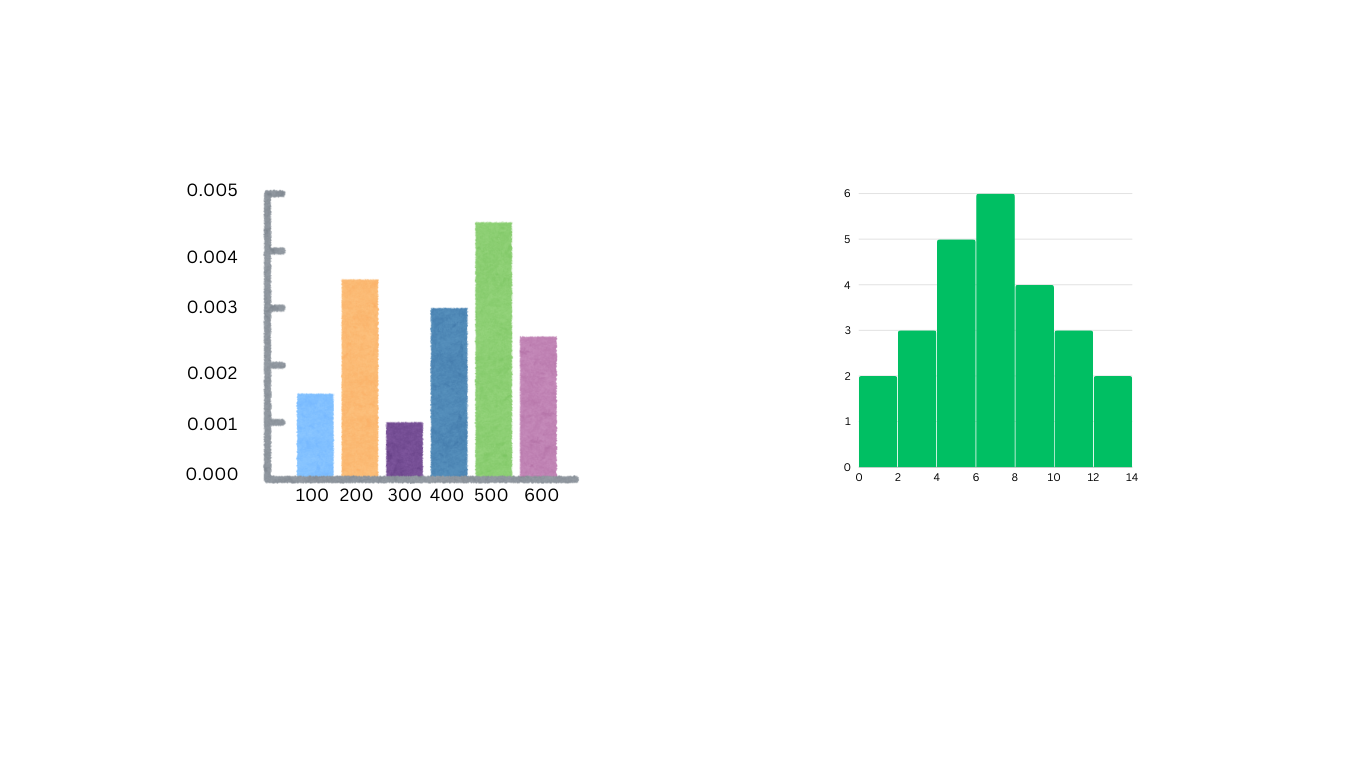
Bar Chart
A bar chart presents the category of data, like a bar plot or bar chart graph. rectangular bar is proportional to the data values.
Features of Matplotlib
- It is used in various types of graphical representation, like line graphs, bar graphs, and histograms.
- Matplotlib works with Numpy arrays and the Scipy stack.
- It provides a large number of plots that are useful to understand market trends and relationships.
Plotly
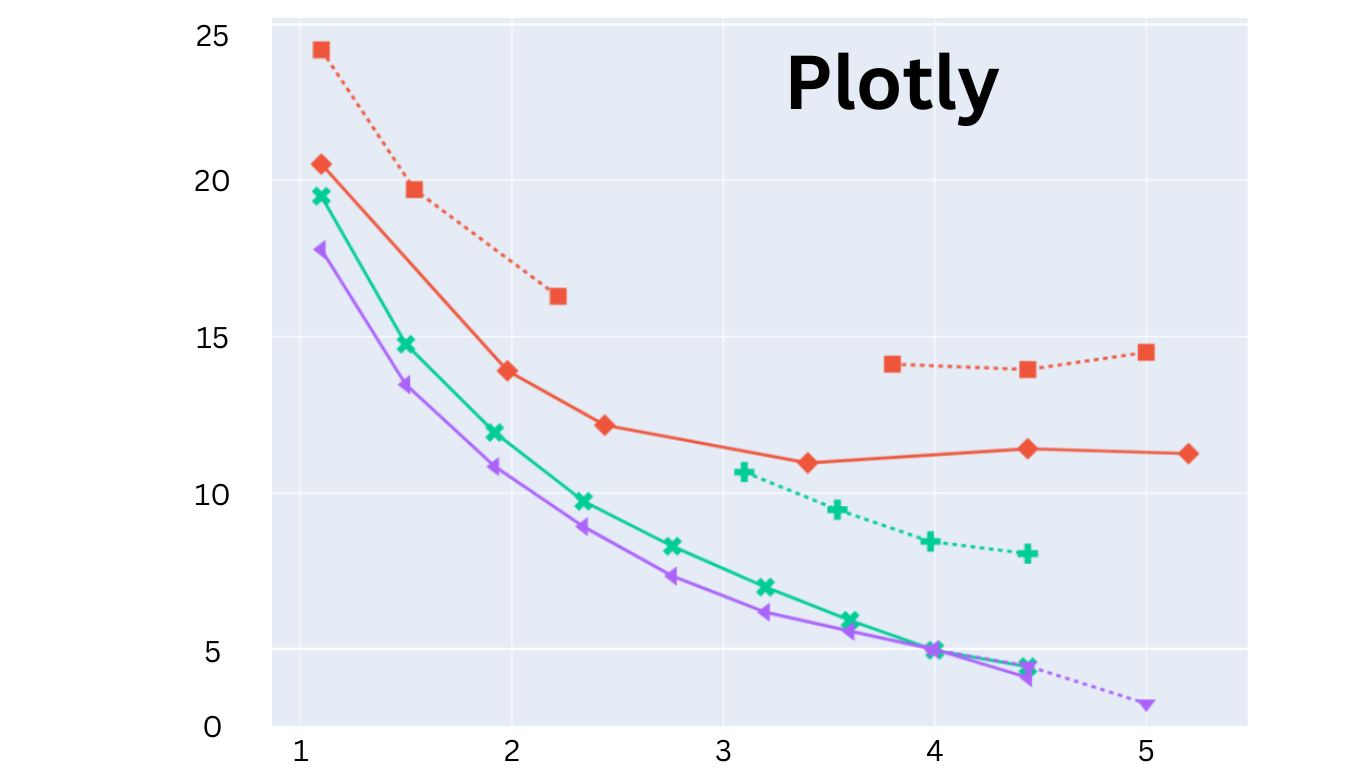
Plotly is most popular data visualization library in Python. It delivers an interactive plot, and beginners can easily understand the plot. Plotly is used to handle financial, geographical, statistical and scientific data.
Features of Plotly
- It is effective on both local and web browsers.
- It is an open-source, interactive, and high-level visualization library.
- Able to view in Jupyter notebooks, standalone HTML file and online hosted.
Seaborn
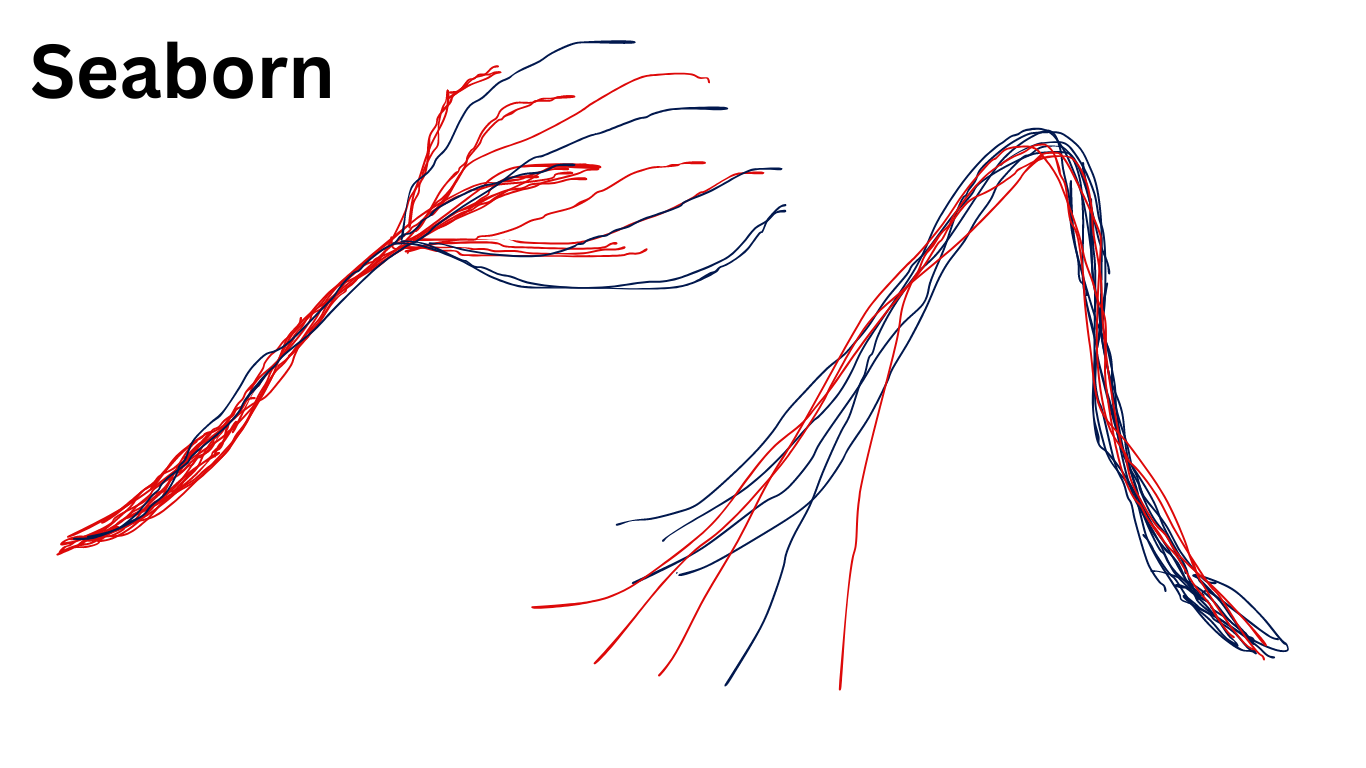
Seaborns provide a variety of large-scale, visualized patterns. It is usually designed to work with Pandas data, and it is more widely used for visualization.
Features of Seaborn
- It provide essential mapping and aggregations to form information visuals.
- It is to explore and provide for understanding data in better and more detailed ways.
- Provide beautiful and informative graphics and high-level data.
Altair
Altair is one of the visualization libraries for data in Python. It defines the data in columns that are on separate axes, like the X-axis and the Y-axis. Altair is designed to create interactive visualizations easily and quickly.
Feature of Altair
- User-friendly and API-built on JSON specification
- It is working on Python 3.6, JSON schema, NumPy, and Panda.
Bokeh
For the modern web browser, Bokeh is most powerful Python library for data visualization. It is used to developing interactive plots and dashboards for complex and streaming data sets.
Features of Bokeh
- powerful Python library for web browser
- It offers a self-created graph.
- It produces well-known visualizations.
- It provides different types of method to generate chart and plots, like box plots, bar plots, and histograms.
Geoplotlib
It allows the user to build maps and plot geographical data. It is designed with an entire database of maps.
Features of Geoplotlib
- It has the features of object-oriented programing language
- It has to create highly interactive maps with major functionalities like planning and designing.
- It provides the tools to create various types of maps, such as density maps.
Pygal
It provides interacting plots that are built with the Python library. It provides various types of formats for visualization, like SVG, PNG, web browser, and more.
Features of Pygal
- It allows you to save visualizations in various types of formats, like PNG, SVG, and web.
- It provides experience with data exploration and filtration.
- It allows the user to create more interacting plots.
How do I use data visualization in Python?
Python libraries are designed with their own specifications for data visualization.
There are some steps to using data visualization in Python.
Step1: Packages importing
The first step is to import the packages from data visualization in Python, which are necessary. These packages help for processing Panda, Matplotlib visualization, seaborn visual, and Numpy calculations.
Step 2: Import and clean data
It is important to import and clean the data for perfect data visualization.
Step 3: Create Visualization
After importing and cleaning data, you can create different types of visualization, from beginner to advanced.
Conclusion
Data visualization in Python library is the most popular visualization technique that can create many types of plots according to the user’s needs. It help to find most popular libraries for data visualization in deep way. It is designed for both beginner and advanced users. Python provides many types of library packages with lots of features to create different types of plots.
Related topics about data visualization: You should know about:
follow me : Twitter, Facebook, LinkedIn, Instagram